Measurement
A method for measuring and reporting short form video performance that avoids vanity metrics
How to run short form video measurement and reporting in the UK, with attribution models, benchmark sources and a scoring rubric for vertical campaigns.
What to take away
- A Manchester retailer spending £1,200 a month on paid vertical video needs more than views. A view is not a decision.
- Attribution is a choice, not a fact. Last-click, platform-reported and incrementality methods give different answers.
- Benchmarks need a source and a date. Platform dashboards, IAB UK guidance and your own account history are the three defensible options.
- UK rules on consent, ad labelling and content safety apply to short form video as they do to other channels.
- A scoring rubric turns a pile of metrics into one decisionscale, adjust or stop.
Why view counts fail as a primary measure
A view tells you the video started playing. It says nothing about whether anyone remembered it, bought anything or came back. Platforms often count a view after a very short exposure, which flatters reach figures in reports.
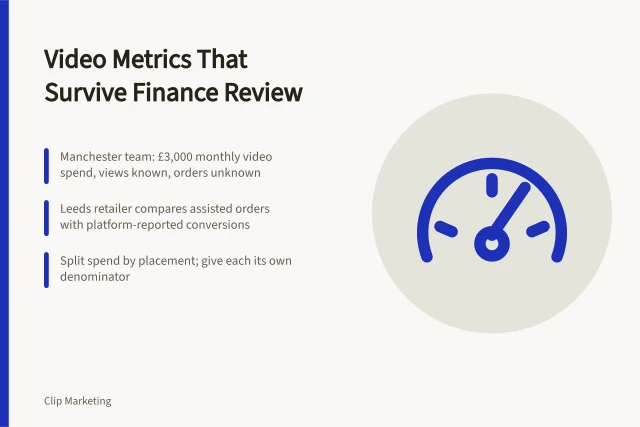
For a small England-based brand, the practical problem is budget. If the marketing lead reports 400,000 views but cannot say what those views cost per sale, the next budget round becomes an argument rather than a decision.
The fix is to pair a reach metric with a commercial metric. Views describe distribution. Cost per acquisition, cost per qualified lead or cost per incremental session describe value. Both belong in the same table, on the same page.
A further habit helps: write the campaign objective above the numbers, not in an appendix. A campaign built to drive awareness should not be judged on cost per lead. A lead generation campaign should not be excused by reach alone.
Choosing an attribution model you can defend
Attribution assigns credit for a conversion to the touchpoints that came before it. Every model is an approximation. The real question is whether the approximation is good enough for the decision in front of you.
Attribution Models Compared
Last-click
- Complexity
- Simple
- Video bias
- Understates
- Best use
- Basic tracking
Platform-reported
- Complexity
- Simple
- Video bias
- Overstates
- Best use
- Creative diagnostics
Incrementality test
- Complexity
- Costly
- Video bias
- Cleanest read
- Best use
- Quarterly test
Last-click attribution is simple and understates video, because video usually sits early in the journey. Platform-reported attribution tends to overstate the platform's own contribution. Incrementality testing, using holdout groups, gives the cleanest read but costs more to run.
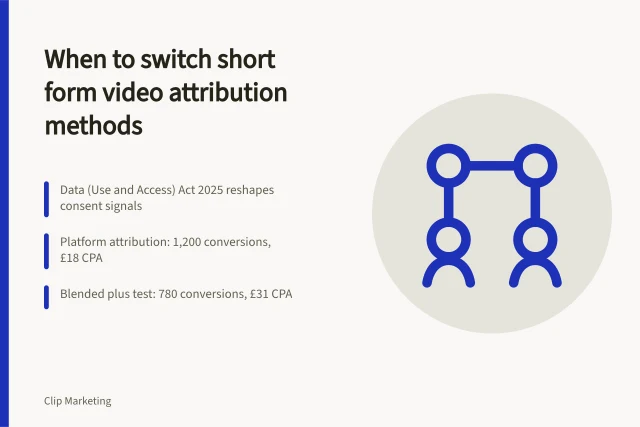
For most UK teams a blended approach works. Use platform data for creative diagnostics. Use your own analytics for channel comparison. Run one incrementality test a quarter on the channel that consumes the most budget.
Name the tools you will use. Google Analytics 4 is free and suits owned-site conversion tracking with last-click or data-driven models. Meta Ads Manager is free with ad spend and reports platform-attributed conversions by default. TikTok Ads Manager is also free with ad spend and reports view-through windows for creative diagnostics.
For paid multi-touch attribution, Northbeam suits ecommerce teams that want modelled and deterministic paths in one view. Triple Whale suits Shopify stores because it combines attribution with profit and margin dashboards. AppsFlyer and Adjust are mobile measurement partners priced by attribution volume, and they suit app campaigns.
Our guide to short form video attribution methods in England walks through the trade-offs in more detail.
Whatever you choose, write it down. A report that says "last-click, 30-day window, excludes view-through" is auditable. A report that says "attribution" is not.
State the conversion definition as well. A purchase, a lead form and an app install are different events. Two teams can agree on last-click and still disagree about what counts as a conversion. That produces a reconciliation problem that looks like bad data but is not.
The metrics that belong in a monthly report
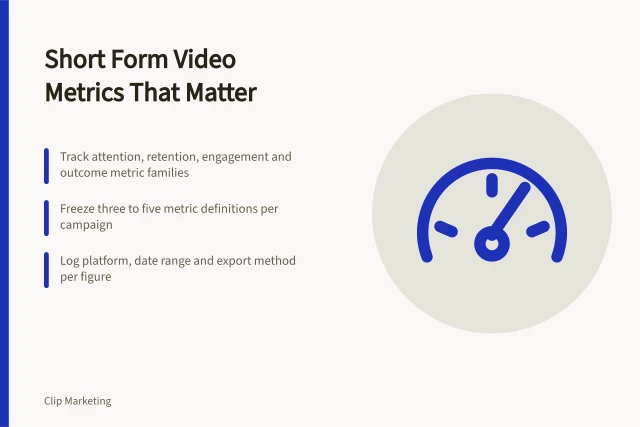
Group metrics into three layers. Each layer answers a different question and speaks to a different audience.
Four Metric Layers and Audiences
Layer
- Distribution
- Seen?
- Engagement
- Attention earned?
- Commercial
- Did it pay?
- Brand
- Slow effects?
Question
- Distribution
- Creatives weekly
- Engagement
- Creatives weekly
- Commercial
- Executives monthly
- Brand
- Executives quarterly
Audience
- Distribution
- Engagement
- Commercial
- Brand
| Layer | Example metrics | Question it answers |
|---|---|---|
| Distribution | Impressions, reach, view-through rate, average watch time | Did the video get seen? |
| Engagement | Saves, shares, comments, profile visits, follower growth | Did it earn attention beyond the feed? |
| Commercial | Cost per lead, cost per acquisition, return on ad spend, incremental conversions | Did it pay? |
A fourth layer, brand, sits alongside these. Brand lift studies and search volume trends can show effects that click data misses. They are slower and costlier, so run them less often. Nielsen and Kantar sell brand lift studies. They suit quarterly checks rather than monthly reporting.
The platform definitions behind each figure vary. Our breakdown of short form video key metrics: data and sources sets out what each platform reports and how the numbers are calculated. That is the first thing to fix if two dashboards disagree.
The common mistake is reporting all four layers at the same cadence to the same people. Executives need the commercial layer monthly and the brand layer quarterly. Creatives need engagement data weekly. Nobody needs everything at once.
Benchmarks, sources and how to use them honestly
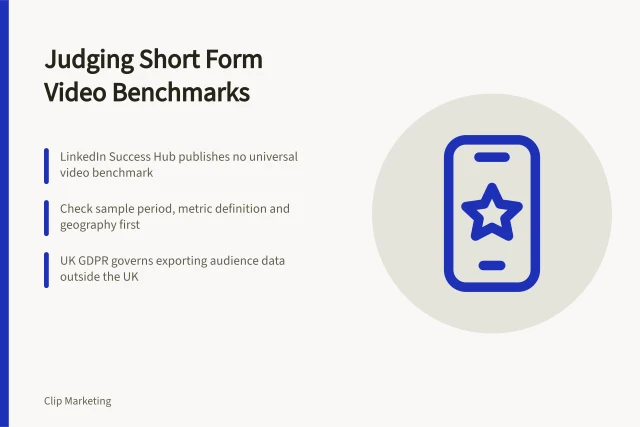
A benchmark is only useful if you can name where it came from and when it was collected. Platform dashboards, industry bodies and your own account history are the realistic options.
IAB UK publishes measurement guidance through its digital ad measurement hub, a sensible starting point for agreeing definitions with agencies and media owners. Definitions matter, because "view" and "engagement" mean different things on different platforms.
Where no published benchmark exists, use a labelled illustrative example. For instance, a team paying £400 a month for production might treat a cost per lead of £12 as acceptable if the average order value is £90. That is an example, not a standard, and it should be labelled as one.
External studies can help when your own history is thin, but only if you check how they were put together. Our guide to short form video benchmark research in England explains how to judge sample size, category fit and budget range before adopting a published figure.
Other benchmark sources include GWI for audience survey data and Similarweb for market and traffic estimates. Both are subscription services. Tubular Labs sells social video intelligence, which suits teams comparing formats and creators across platforms.
Methodology notes belong next to the numbers. A single line covering date range, sample size and whether spend includes agency fees prevents most arguments before they start.
How to set targets when no benchmark exists
Not every objective has a published figure behind it. When that happens, set the target from your own evidence rather than from a number someone remembered in a meeting.
Start with the last three comparable campaigns. Take the median cost per result, not the best run, because the best run usually reflects a creative outlier or a lucky audience. Then set the target slightly better than the median and treat the first month as a test of whether the target is realistic.
Write down the assumptions the target rests on: average order value, lead-to-sale rate, production cost, media spend. If any assumption is a guess, say so in the report. A visible assumption is easier to correct than a hidden one.
Review targets each quarter. A target that has not moved in a year is usually measuring habit rather than performance.
Reporting cadence and format
Reports fail when they are long and arrive late. A one-page monthly summary with three charts beats a twelve-page deck nobody reads.
Structure the page around decisions. Lead with spend and outcome. Follow with the two or three metrics that moved most. Close with what you will change next month.
Keep a consistent template so month-on-month comparison is possible. Changing the layout every month resets the reader's understanding and hides trends.
Quarterly, add a deeper review covering creative themes, audience segments and any incrementality test results. This is also the point to revisit benchmarks, because platform behaviour shifts.
Two reports are better than one here: a weekly creative note for the people making videos, and a monthly commercial summary for budget holders. They share the same underlying data and the same definitions, which keeps both audiences from arguing about numbers instead of decisions.
Circulate the report before the meeting that discusses it. A decision meeting works better when the numbers have been read in advance and the questions are about choices rather than definitions.
UK rules that affect measurement and reporting
Measurement touches personal data, which brings the Information Commissioner's Office into scope. The ICO's guide to the Privacy and Electronic Communications Regulations explains consent rules for electronic marketing, including social media advertising. Pixel-based tracking on your own site needs a lawful basis.
Advertising content itself is regulated by the Advertising Standards Authority. Its social and political advertising topic page covers rules applying to promotional posts and paid partnerships, including labelling requirements.
Platform safety duties sit under the Online Safety Act 2023, which governs how online content, including short form video, must be handled by regulated services. This shapes what you can publish rather than what you measure, though the two meet in campaign reviews.
For agencies managing campaigns across several client accounts, LinkedIn's ad resources for marketing agencies are a useful reference for structuring permissions and client reporting.
Keep a short evidence file for each campaign: the ad label wording used, the consent notice shown and where the creative appeared. If a complaint arrives, the file turns a scramble into a routine reply.
A scoring rubric for vertical video campaigns
Use a rubric to force a decision. Score each campaign on five dimensions, weight them and act on the total. The weights below suit a lead generation goal. Adjust them for awareness or retail.
Vertical Video Campaign Scoring Rubric
- Cost efficiency30% weight
- Watch-through20% weight
- Engagement quality20% weight
- Attribution confidence15% weight
- Compliance and labelling15% weight
| Dimension | Weight | Score 1 (weak) | Score 3 (acceptable) | Score 5 (strong) |
|---|---|---|---|---|
| Cost efficiency | 30% | More than 50% above target | Within 20% of target | More than 20% below target |
| Watch-through | 20% | Under 15% at three seconds | 15% to 30% | Over 30% |
| Engagement quality | 20% | Saves and shares negligible | Some saves, few shares | Consistent saves and shares |
| Attribution confidence | 15% | Platform-reported only | Blended model documented | Incrementality tested |
| Compliance and labelling | 15% | Missing disclosures | Disclosure present | Disclosure and consent documented |
Multiply each score by its weight, sum the results and read the total out of five. Treat anything below three as a signal to adjust creative or targeting before increasing spend. Treat anything above four as a candidate for scale.
Between three and four, change one variable at a time and re-score after two weeks. Changing creative, audience and budget together tells you nothing about which one mattered.
The rubric is not a substitute for judgement. It is a way to make a judgement consistent and explainable to people who were not in the room.
Common reporting mistakes and how to avoid them
Most reporting problems come from mismatched definitions rather than bad data. If the platform counts a three-second view and your internal dashboard counts a ten-second view, the two numbers will never reconcile.
Reconciling Mismatched Definitions
Do platform and internal view definitions match?
Numbers reconcile
Align definitions first
A second common failure is comparing campaigns with different objectives. An awareness campaign and a conversion campaign should not share a cost per result target.
A third is ignoring the lag between exposure and purchase. Short form video often works slowly, especially for considered purchases. A seven-day window may miss the effect entirely.
Watch for dashboard defaults too. Many platforms report their own conversions by default, which quietly credits the same sale to two channels when both were present in the journey.
Our round-up of short form video measurement mistakes in England covers these in more depth, including the reconciliation errors that cause the most friction between marketing and finance.
Tools, permissions and data hygiene
Before comparing anything, make sure the data pipeline is sound. Check that tracking tags fire correctly, that conversion definitions match across platforms and that consent status is recorded alongside each event.
Agree a single source of truth for spend and conversions. Platform dashboards and your analytics platform will disagree. Decide in advance which one governs the report and note the variance openly.
Document permissions for agency and freelancer access. Shared logins create audit problems and make it harder to tie a change to a specific person.
Record platform changes as they happen. A quiet change to view counting or an attribution window can move every number in the report. A note in the log explains the step change without panic.
How measurement should change during 2027
Platform reporting keeps shifting as privacy rules tighten and signal loss affects tracking. Expect more reliance on modelled conversions and on first party data collected with consent.
That makes owned channels more valuable. Email lists, app registrations and logged-in experiences give you a measurement base that does not depend on third party cookies.
Creative volume also keeps rising. When a team publishes fifty variants a month, measurement has to be automated enough to surface winners without manual spreadsheet work.
Our outlook piece on short form video: trends and outlook for England in 2027 covers the direction of travel for formats, budgets and platform features.
Building a benchmark set from your own data
Industry benchmarks are a starting point. Your own history is more useful, provided you record it consistently.
Start by logging every campaign with the same fields: objective, spend, views, conversions and attribution method. After three months you will have enough data to set internal targets.
Review the set quarterly. Remove campaigns that used different tracking setups. Flag any month where a platform changed its definitions.
Keep the log somewhere that survives staff changes. A spreadsheet owned by one person, on one laptop, is not a benchmark set; it is a private memory.
This internal benchmark becomes the reference for the scoring rubric. Without it, every score is a guess.
Common questions
How often should short form video results be reported?
Monthly for spend and commercial outcomes, weekly for creative diagnostics and quarterly for brand work. Reporting more often than the data changes adds noise.
Which single metric best predicts campaign success?
There is no universal one. For lead generation, cost per qualified lead is usually the most defensible. For awareness, incremental reach measured against a holdout is stronger than raw views.
Do UK consent rules apply to video ad measurement?
Yes. Where tracking involves personal data, the ICO's PECR guidance applies. Consent must be collected before non-essential cookies or similar technologies are set.
Can a small team run incrementality tests?
Yes, at a modest scale. A holdout of a few thousand users in a defined region can produce a usable read, provided the test runs long enough to cover the purchase cycle.
In this guide
- Short form video key metrics explained for marketing teamsA plain guide to short form video key metrics, covering which numbers to track, which to ignore and how to source each figure so your reporting holds up.
- A short form video reporting dashboard that survives a board reviewBuild a short form video reporting dashboard that ties platform metrics to business outcomes, with a scoring rubric, consent checks and a weekly refresh routine.
- When to switch short form video attribution methodsCompare short form video attribution methods for English marketing teams: platform, last click, blended and incrementality testing, plus a before and after table.
- Short form video measurement mistakes that flatter or that inform decisionsShort form video measurement mistakes in England, plus the criteria to apply when you build a report that stands up to finance and compliance review.
- Where can you find reliable short form video benchmark research?Short form video benchmark research is scarce and often misread. Here is how to judge a benchmark study, apply it to England, and report it honestly.