Measurement
Part of A method for measuring and reporting short form video performance that avoids vanity metrics
Short form video key metrics explained for marketing teams
A plain guide to short form video key metrics, covering which numbers to track, which to ignore and how to source each figure so your reporting holds up.
What to take away
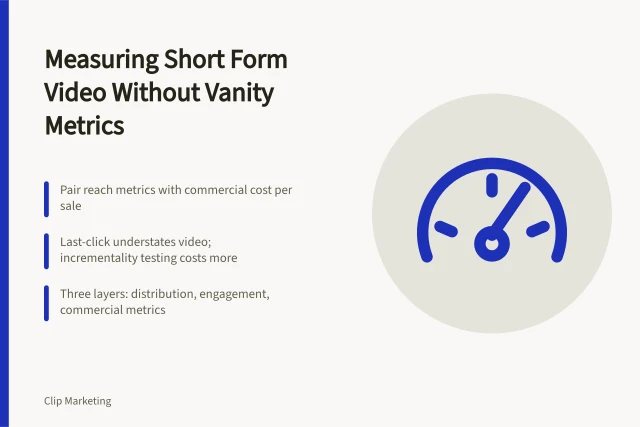
Short form video key metrics are the small set of numbers that tell you whether a vertical video earned attention, held it and produced a business result. Views alone cannot do that. You need a completion or watch-time figure, an engagement figure and a conversion figure, each tied to a named source.
Pick three to five metrics per campaign and keep the definitions frozen for the reporting period. Anything you cannot source from a platform export or a first-party system should be labelled as an estimate.
Start with the definitions, not the dashboard
A metric is only useful when everyone agrees what it counts. A view on one platform may mean three seconds of playback; on another it may mean a full impression. Write the definition down before you pull the first report.
The IAB UK measurement hub collects standards and guidance for digital ad measurement, a sensible reference when you need to justify a definition to a client or finance team. See IAB UK measurement guidance.
Once definitions are fixed, build the wider reporting rhythm around them. The measurement and reporting guide sets out how weekly and monthly cycles fit together, so the metric list here has somewhere to live.
The four families of metric worth tracking
Attention metrics cover impressions, views and average watch time. They tell you whether the opening seconds worked.
Four metric families at a glance
Attention
- Example metric
- Average watch time
- Typical source
- Platform analytics
- What it answers
- Did the opening hold?
Retention
- Example metric
- Completion rate
- Typical source
- Platform analytics
- What it answers
- Did the whole video land?
Engagement
- Example metric
- Saves and shares
- Typical source
- Platform analytics
- What it answers
- Would someone pass it on?
Outcome
- Example metric
- Cost per lead
- Typical source
- CRM or ad account
- What it answers
- Did it produce a result?
Retention metrics cover completion rate and drop-off points. A vertical video that loses half its audience at second three has a hook problem, not a distribution problem.
Engagement metrics cover saves, shares, comments and profile visits. These come closer to intent than a view, though they still sit above the sale.
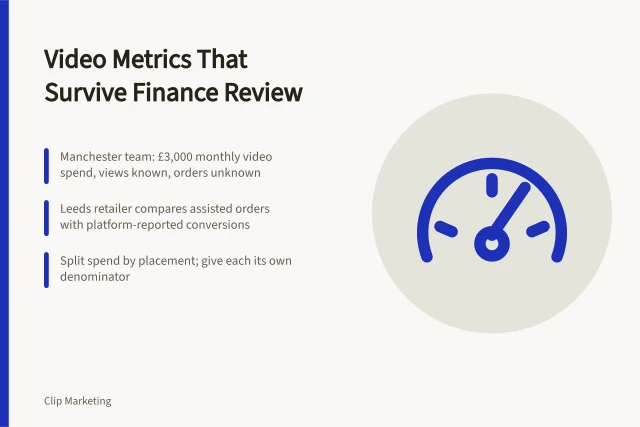
Outcome metrics cover clicks, leads, add-to-cart events and revenue. These are the numbers your finance lead will ask about, so they must come from a system you control rather than a platform summary.
Four families of metric
| Metric family | Example metric | Typical source | What it answers |
|---|---|---|---|
| Attention | Average watch time | Platform analytics export | Did the opening hold people? |
| Retention | Completion rate | Platform analytics export | Did the whole video land? |
| Engagement | Saves and shares | Platform analytics export | Would someone pass it on? |
| Outcome | Cost per lead | Your CRM or ad account | Did it produce a result? |
Source every number before you quote it
Reporting falls apart when a figure arrives with no owner. For each metric, record the platform, the date range and the export method.
Source every number before quoting
- Record the platform
- Record the date range
- Record the export method
- Name an owner for each figure
- Use dated benchmarks with sample stated
For paid video, the platform's own guidance is a reasonable starting point for what it will and will not report. Google Ads explains how video campaigns are structured and measured in its guidance on running successful campaigns.
If your videos support employer branding or recruitment, workforce data frameworks help you connect reach to hiring outcomes rather than guessing. The CIPD's people analytics resources cover how to use workforce data responsibly.
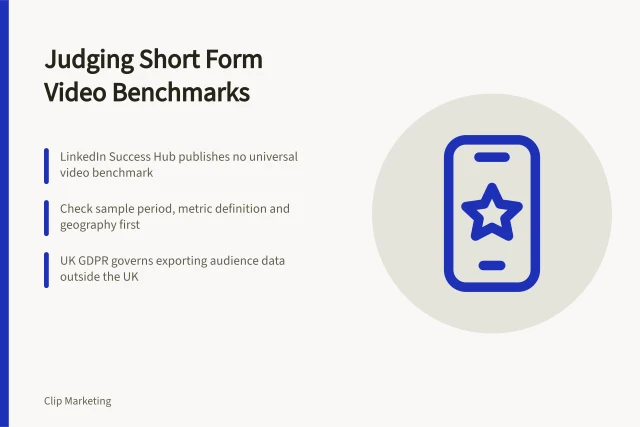
Benchmark figures are the weakest link in most reports. A completion rate from another brand's account tells you very little about yours. Where you need a comparison, use a dated England benchmark set and state the sample. Our benchmark research on short form video in England explains how those samples are drawn.
Put the metrics in a table your team can run
A single reporting table beats five dashboards. One row per video, one column per metric, with a source column beside each figure. Keep the table to fewer than twelve columns: more than that and nobody updates it after week three.
Review the table monthly. If a metric has not changed a decision in two cycles, remove it and write down why.
Common questions
How many metrics should a short form video report include?
Three to five per campaign is workable for most teams. Add a metric only when it answers a question someone has actually asked.
Can I compare completion rates across platforms?
Rarely, because each platform defines a view and a completion differently. Compare within a platform over time, and note the definition when you compare across platforms.
What is the difference between a view and a watch?
A view is usually a platform-defined threshold, such as three seconds of playback. A watch figure describes time spent, which is why average watch time is more useful for judging creative.
How often should benchmark figures be refreshed?
At least once a year, and whenever the platform changes its reporting definitions. Always record the date and sample behind any benchmark you publish.